- Solan Sync
- Posts
- [How to in 5 minutes: Claude]How to Create Stunning Data Visualizations with Claude Analysis Tool
[How to in 5 minutes: Claude]How to Create Stunning Data Visualizations with Claude Analysis Tool
Learn to use Claude’s Analysis Tool for immersive data visualizations. Step-by-step guide on generating data, creating visuals, and publishing results.
Try Artisan’s All-in-one Outbound Sales Platform & AI BDR
Ava automates your entire outbound demand generation so you can get leads delivered to your inbox on autopilot. She operates within the Artisan platform, which consolidates every tool you need for outbound:
300M+ High-Quality B2B Prospects, including E-Commerce and Local Business Leads
Automated Lead Enrichment With 10+ Data Sources
Full Email Deliverability Management
Multi-Channel Outreach Across Email & LinkedIn
Human-Level Personalization
How to Create Immersive Data Visualizations with Claude’s New Analysis Tool
The latest update to Claude’s capabilities introduces an exciting feature: the ability to generate and run code for interactive data visualizations. Whether you’re analyzing business performance or uncovering key insights from your data, this tool streamlines the process.
In this step-by-step guide, you’ll learn how to:
Generate sample data for testing.
Use Claude to analyze and visualize your data.
Publish your visualizations for sharing.
Requirements:
A ChatGPT account
A Claude account
Let’s dive in!
Step 1: Generate Sample Sales Data
If you already have a CSV file of your data, you can skip this step. Otherwise, ChatGPT can help you create sample data.
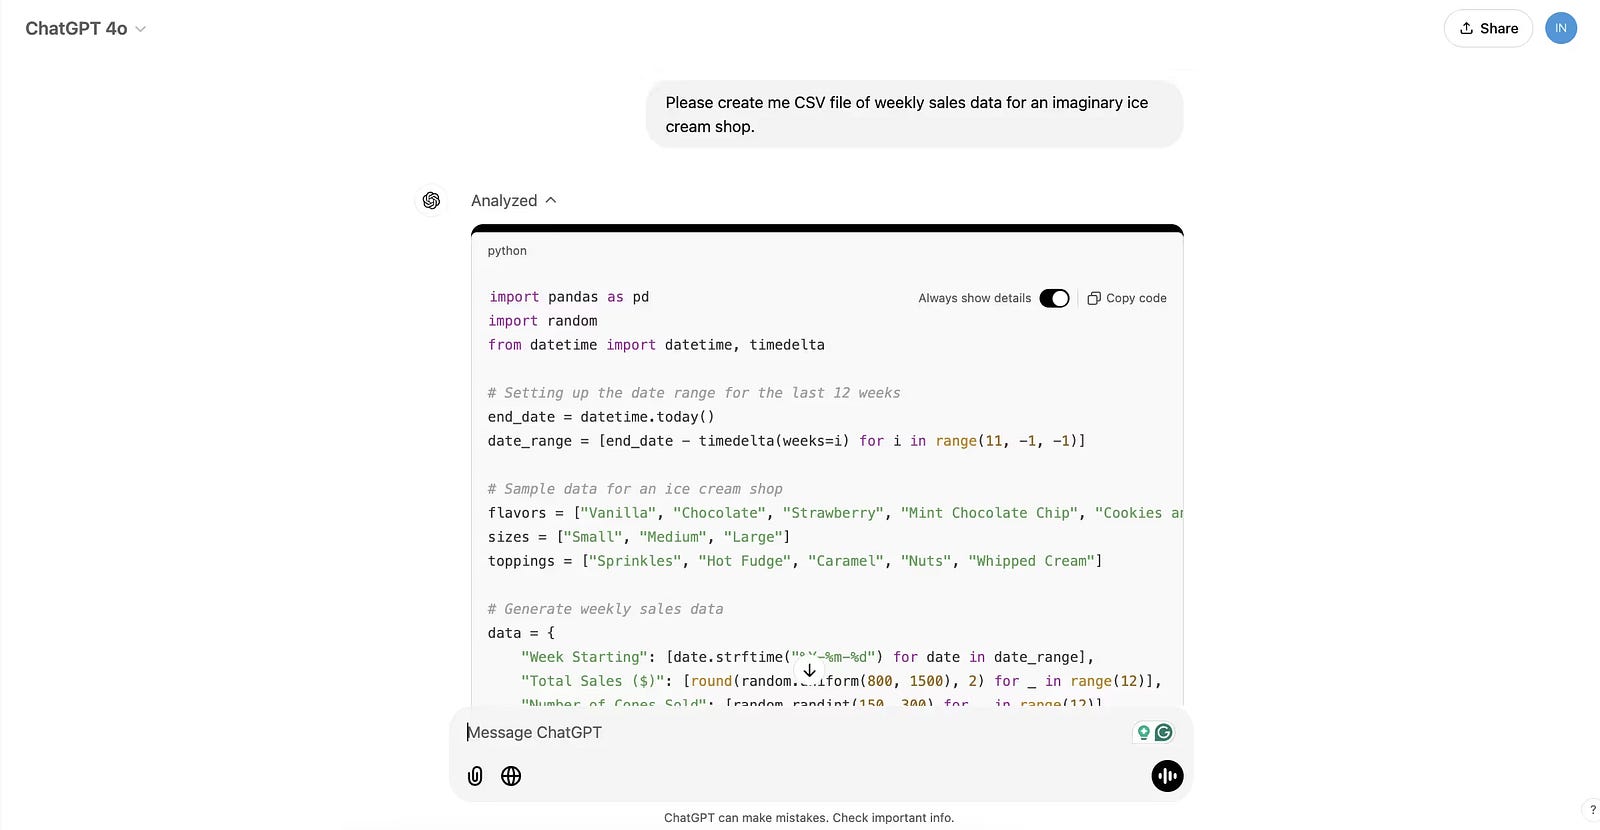
How to Generate Sample Data with ChatGPT:
Open ChatGPT and use the following prompt: “Please create a CSV file of weekly sales data for an imaginary ice cream shop.”
ChatGPT will generate a Python script to create your data, providing a download link for the CSV file.
Converting Existing Data:
If your business data exists in formats like PDFs, Google Docs, or PowerPoint presentations — or spans multiple files — ChatGPT can consolidate it into a single CSV file.
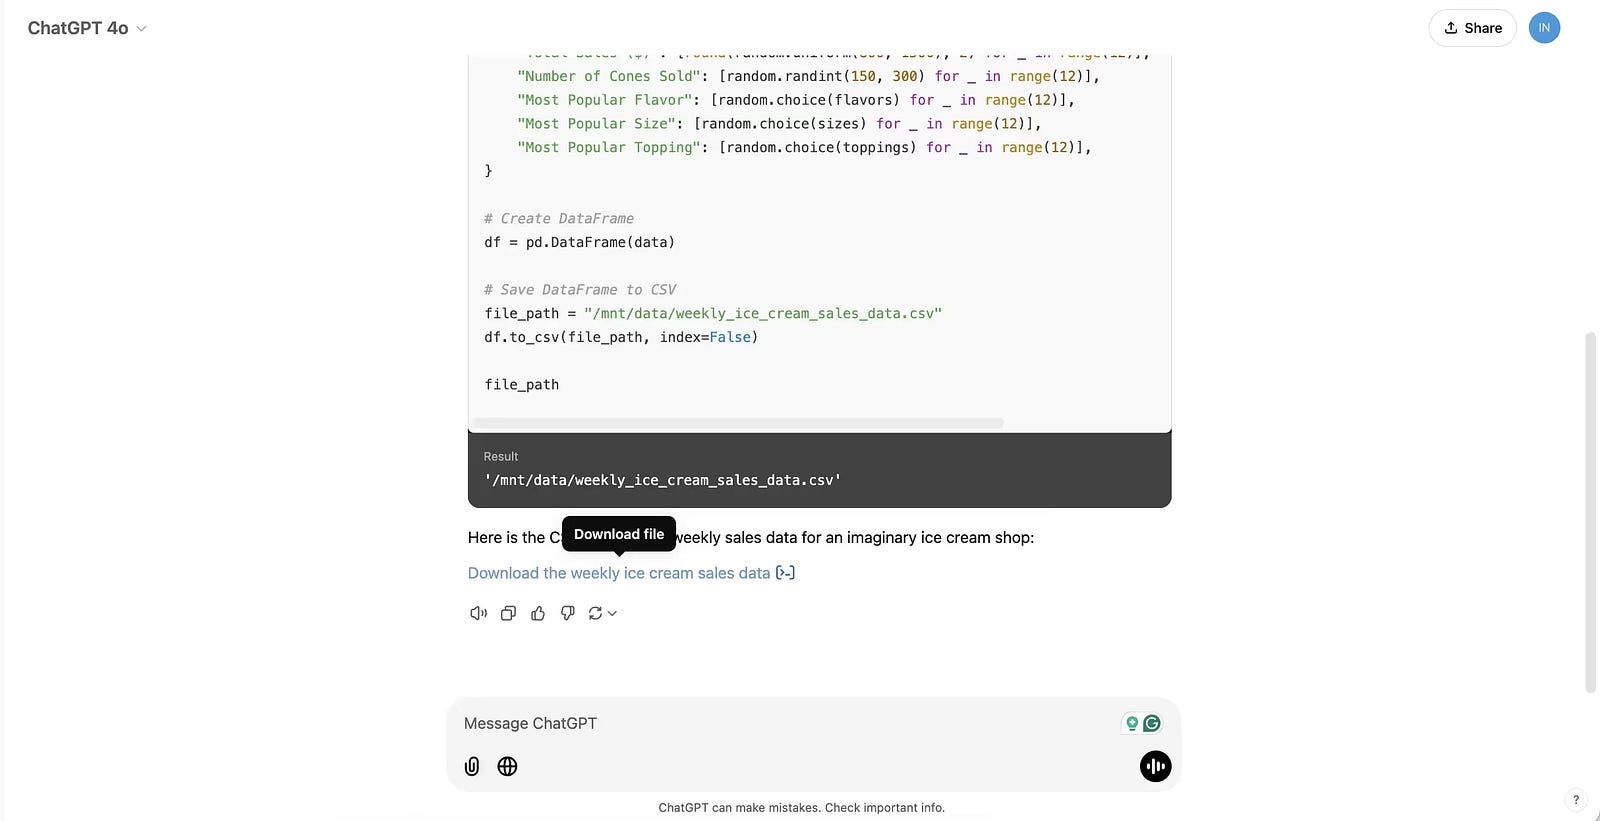
This step ensures that your data is formatted correctly for visualization in Claude.
Step 2: Create an Analysis Tool in Claude
With your CSV file ready, Claude’s analysis tool makes creating visualizations a breeze.
Steps to Create a Visualization:
Open Claude and start a chat with a prompt such as: “Please visualize the sales data to give me insight into the best-selling flavors.”
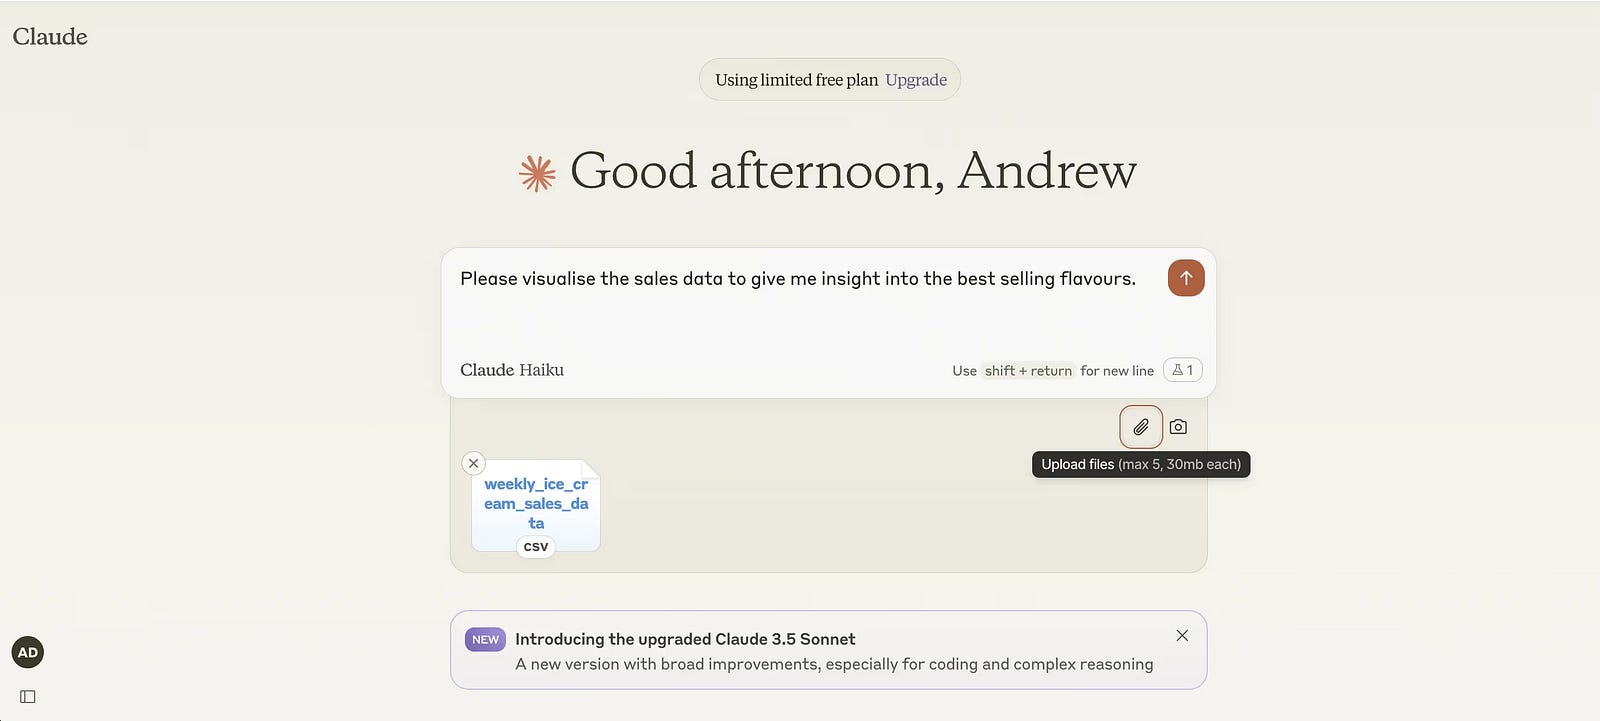
Attach your CSV file using the paperclip icon at the bottom right of the chat window.
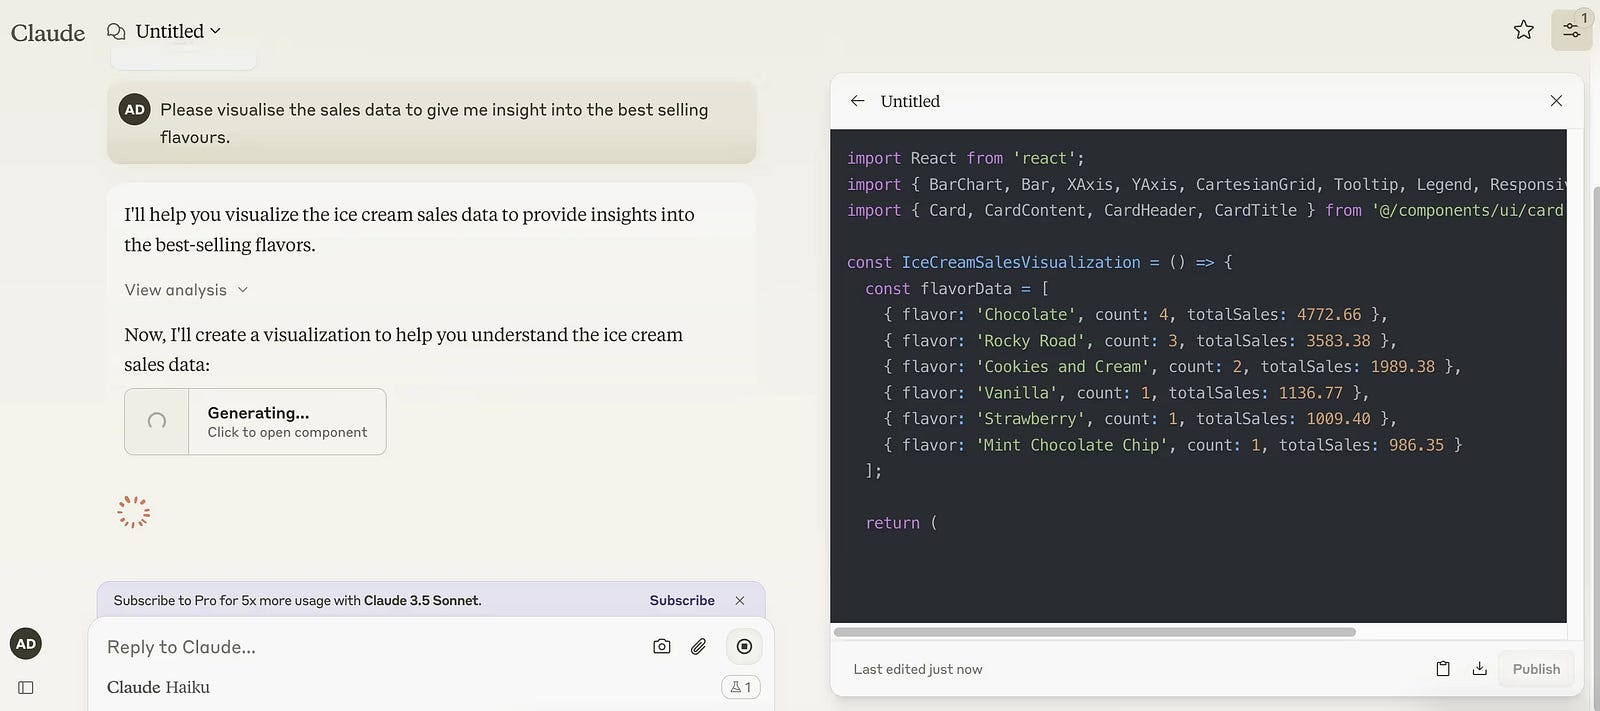
Claude will:
Write the necessary code to process and visualize your data.
Run the code automatically to generate an interactive visualization.
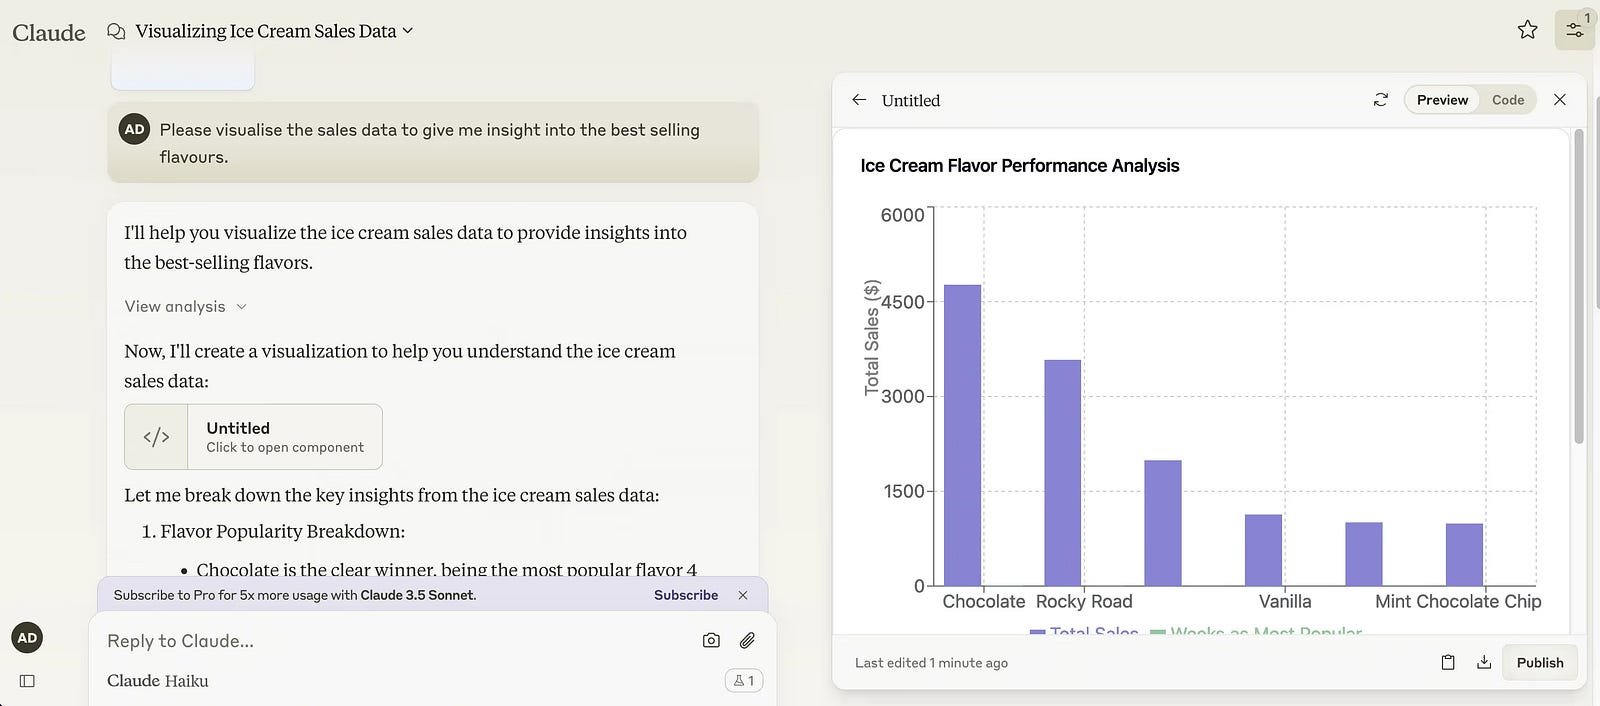
Analyzing Results:
Claude provides both a visual representation and a textual summary of your data. For example, you might find that chocolate and rocky road are your top-selling flavors, as shown in the graph and summary.
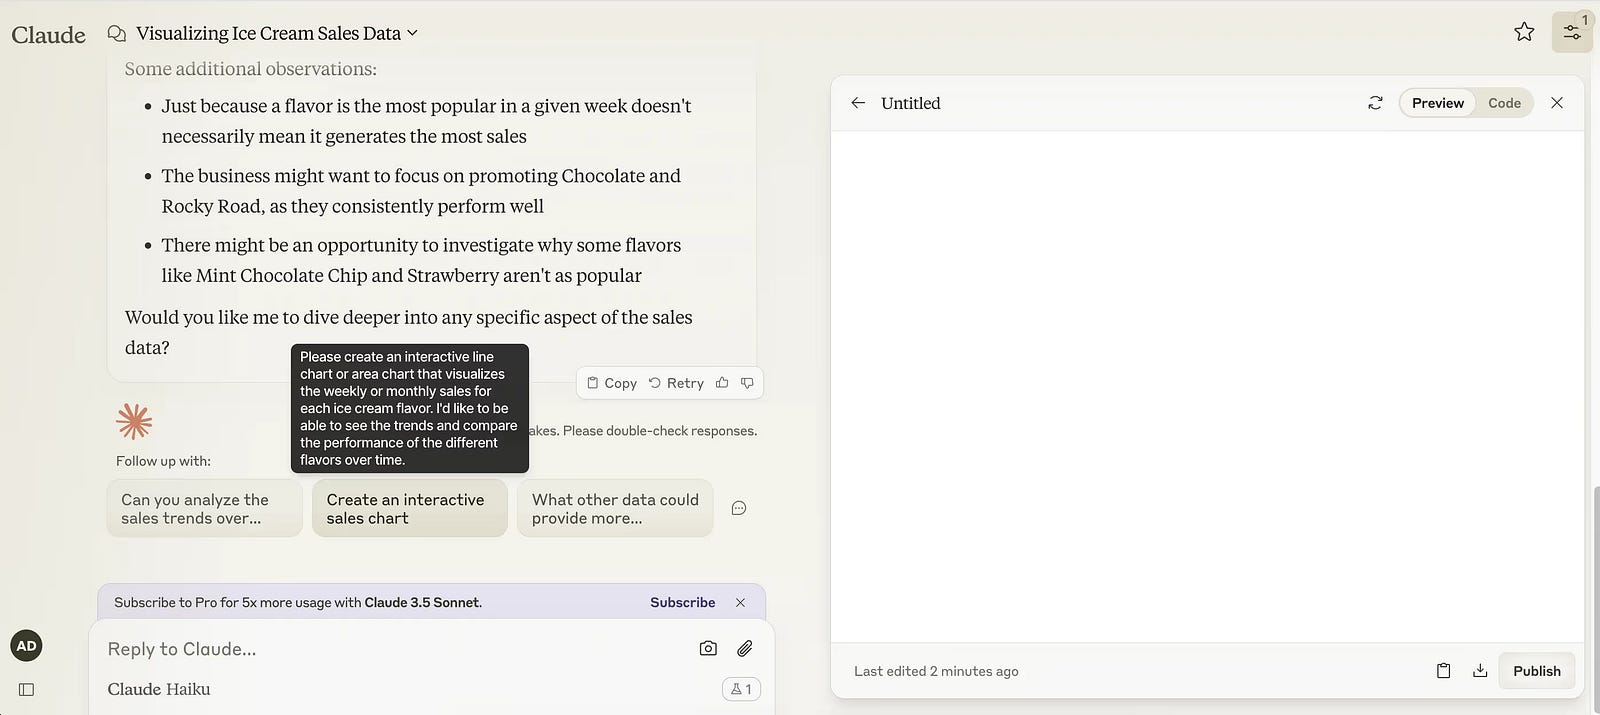
If you’d like a different visualization, ask Claude to rewrite the code. It even suggests prompts for refining your visualizations further.
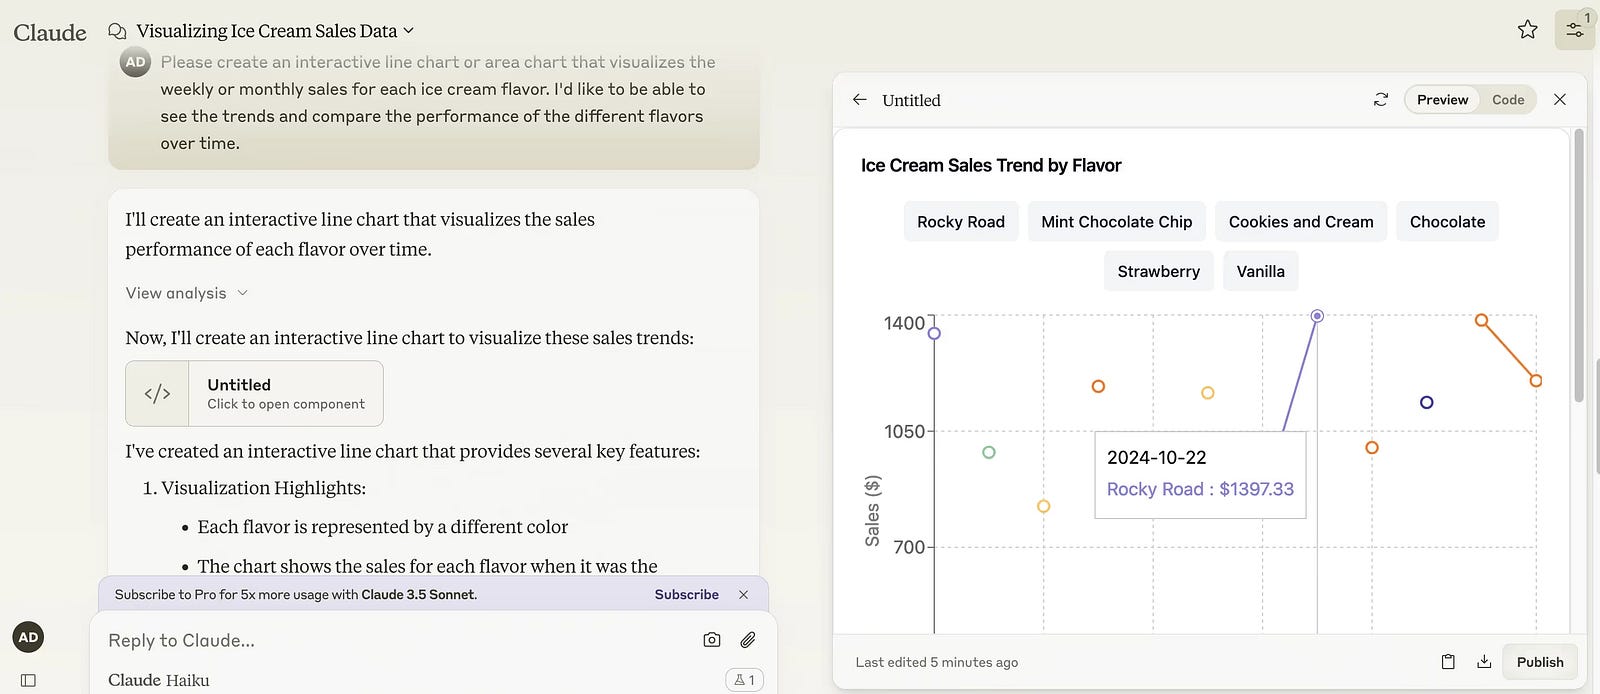
Step 3: Publish Your Data Visualization
One standout feature of Claude’s analysis tool is its ability to publish visualizations as shareable artifacts.
Steps to Publish:
Click the “Publish” button in the bottom right corner of the Claude interface.
On the next screen, select “Publish & Copy Link”.
Once published, Claude generates a URL for your artifact, allowing you to share it with others. You can unpublish the artifact at any time.
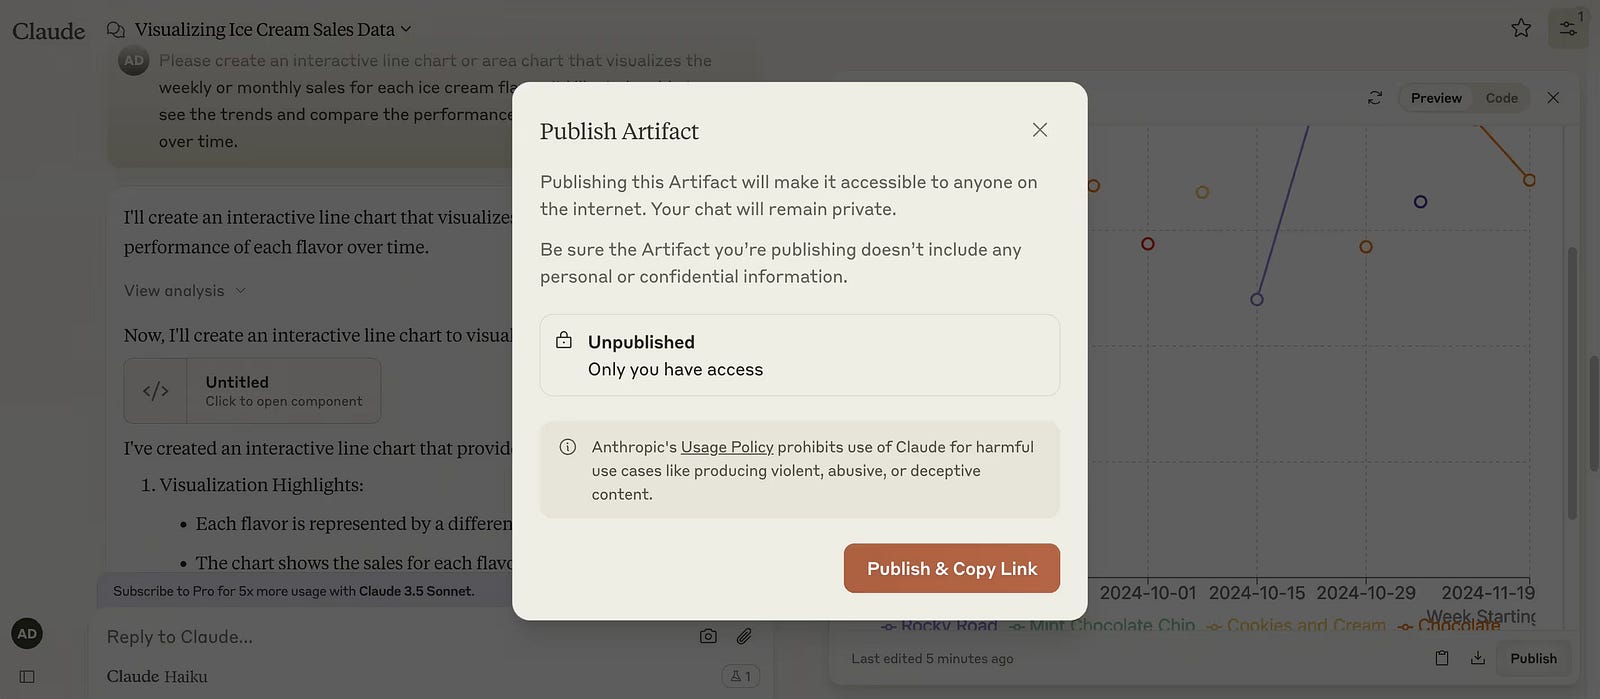
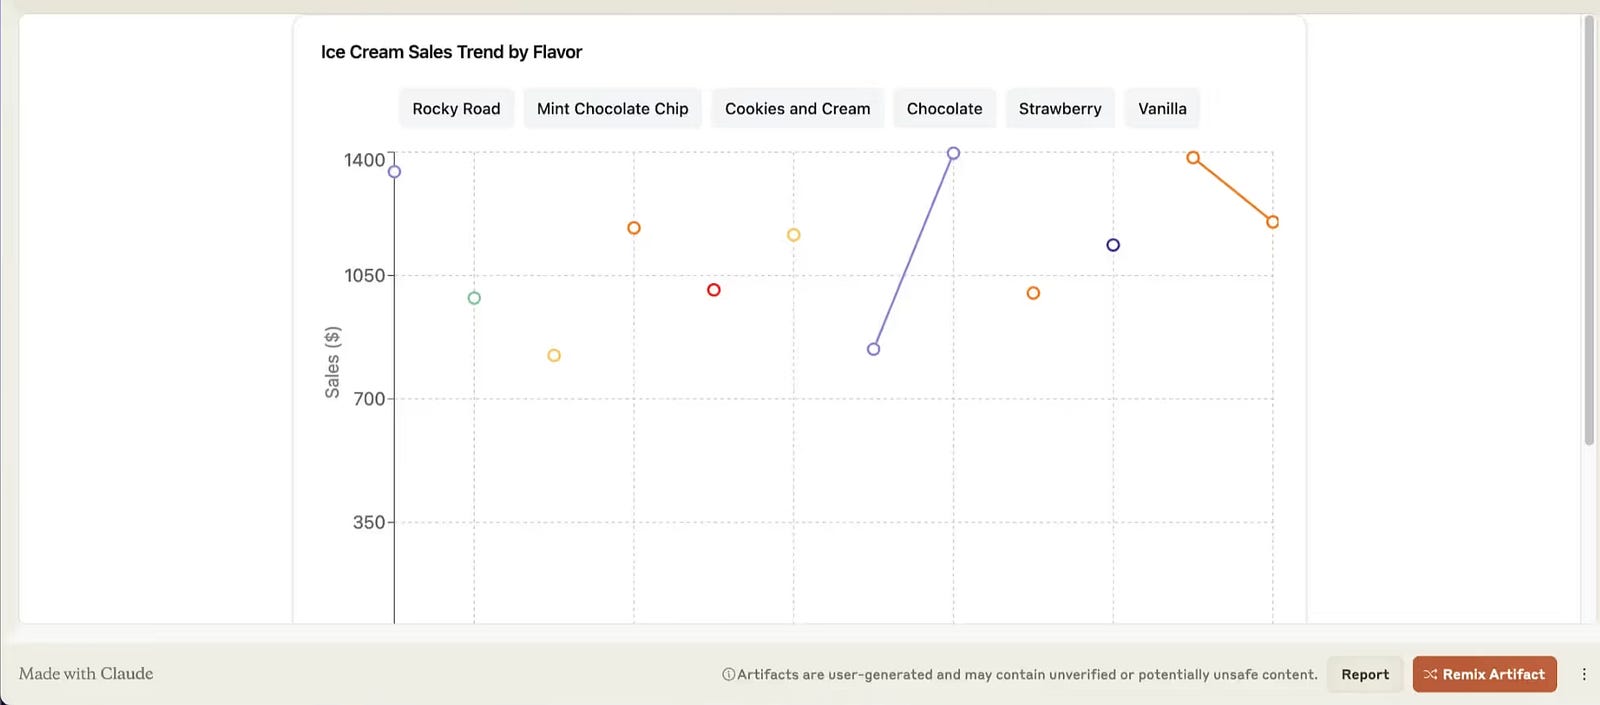
This feature is ideal for collaborating with colleagues or presenting insights to stakeholders.
Why Use Claude for Data Visualization?
Claude simplifies data visualization by:
Handling complex code writing and execution.
Allowing flexible customization for different data views.
Making sharing and collaboration seamless through its publishing feature.
By combining Claude’s coding capabilities with ChatGPT’s data preparation features, you can create immersive, actionable insights in minutes.
Ready to Get Started?
Empower your data analysis workflows with Claude and ChatGPT today. Whether you’re exploring sales trends or diving into deeper analytics, these tools are your gateway to professional-grade visualizations.
Thank you for reading this article so far, you can also access ChatGPT tools and the AI-Powered Business Ideas Guides on my FREE newsletter.
Solan Sync
Get business ideas inspired by the latest academic research, simplified and transformed for practical use, three times…solansync.beehiiv.com
What Will You Get?
Access to AI-Powered Business Ideas.
Access our News Letters to get help along your journey.
Access to our Upcoming Premium Tools for free.


Reply