- Solan Sync
- Posts
- How to Use Mistral Le Chat for Data Analysis & Visualization
How to Use Mistral Le Chat for Data Analysis & Visualization
Learn how to analyze data efficiently with Mistral Le Chat. Upload datasets, generate insights, and create stunning data visualizations in seconds.

The AI Academy: How to Perform Data Analysis with Mistral Le Chat
Whether you’re a data analyst, researcher, or business professional, this guide will walk you through how to leverage Mistral Le Chat for data analysis and visualization.
Step-by-Step Guide to Data Analysis with Mistral Le Chat
1. Sign Up and Access Mistral Le Chat
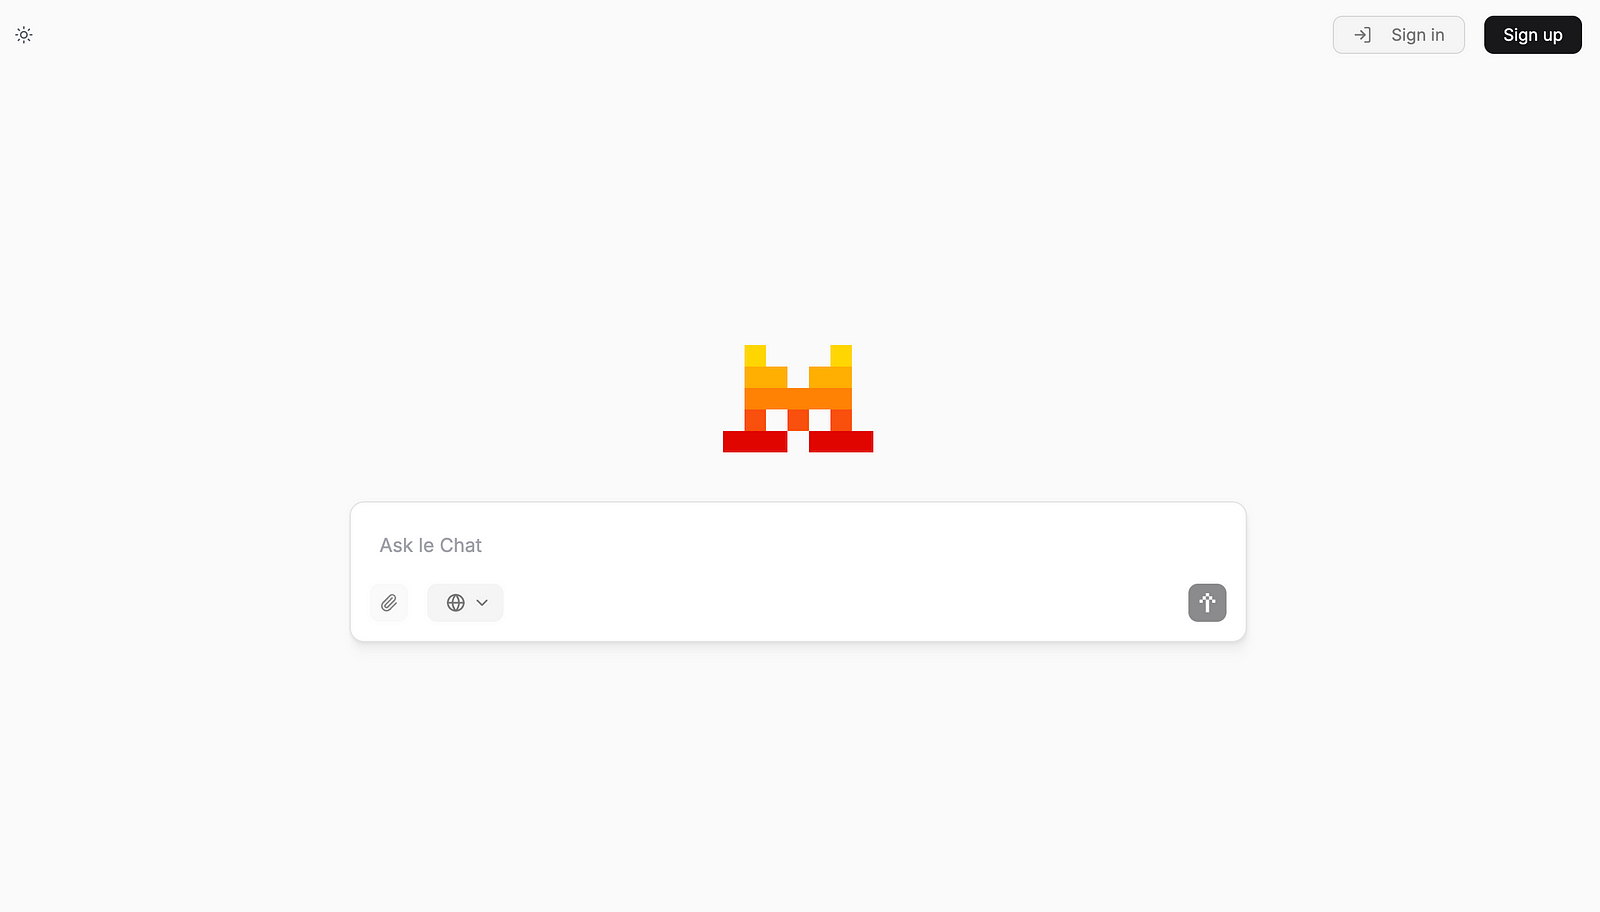
The first step is to create an account on Mistral Le Chat. Follow these steps:
Visit the Mistral Le Chat platform.
Click Sign Up and enter your details.
Verify your account through the email confirmation link.
Log in to start using the tool.
2. Upload Your Data File
Once logged in, you need to upload your dataset for analysis:
Click on the clip icon (📎) located near the prompt box.
Select the file from your computer (e.g., CSV, Excel, or TXT file).
Wait for the upload to complete.
💡 Tip: Ensure that your dataset is clean and formatted correctly to avoid errors in analysis.
3. Enter a Prompt for Data Analysis
Mistral Le Chat uses natural language processing to interpret user prompts. After uploading your file, enter a clear and specific prompt to guide the AI.
Example Prompt:
💬 “[Attach data file] Please analyze this dataset, highlight three key trends, and present findings in a graph.”
The AI will process the file and provide insights based on your request.
4. Review and Interpret the Results
After a few seconds, Mistral Le Chat will generate an analysis that includes:
✅ Key Trends — Major insights from your data.
✅ Statistical Summaries — A breakdown of important figures.
✅ Visual Representation — Graphs, charts, or tables for better understanding.
Generating Data Visualizations with Mistral Le Chat

One of the most powerful features of Mistral Le Chat is its ability to generate custom data visualizations. You can request different types of charts based on your dataset.
Example Commands for Data Visualization
📊 Bar Chart: “Generate a bar chart showing sales trends over the past 6 months.”
🥧 Pie Chart: “Create a pie chart displaying the percentage distribution of different customer segments.”
📈 Line Graph: “Visualize the monthly revenue growth with a line graph.”
📉 Scatter Plot: “Show the correlation between marketing spend and customer acquisition with a scatter plot.”
🔹 The AI will process your request and display the graph within seconds.
Best Practices for Data Analysis with Mistral Le Chat
✅ Use Specific Prompts: Clearly define what insights or visualizations you need.
✅ Clean Your Data: Ensure there are no missing values or inconsistencies in your dataset.
✅ Iterate on Analysis: If the results aren’t as expected, refine your prompt for better output.
✅ Combine Insights: Use AI-generated insights with your domain expertise for deeper analysis.
Conclusion
Mistral Le Chat is a powerful AI-driven tool that simplifies data analysis and visualization. By following this guide, you can quickly extract key insights, generate meaningful graphs, and make data-driven decisions efficiently. Whether for business analytics, research, or personal projects, Mistral Le Chat empowers users with AI-enhanced data analysis capabilities
Thank you for reading this article so far, you can also access ChatGPT tools and the AI-Powered Business Ideas Guides on my FREE newsletter.
Solan Sync
Get business ideas inspired by the latest academic research, simplified and transformed for practical use, three times
What Will You Get?
Access to AI-Powered Business Ideas.
Access our News Letters to get help along your journey.
Access to our Upcoming Premium Tools for free.
Yuki is building an AI Prompt Generator Platform
Hey, I’m a Founder of @ai_solan | an AI Prompt Generator Platform | Web3 Enthusiast | Embracing Innovation and
Reply